AidData’s interactive Chinese public diplomacy dashboard, the first of its kind, has been recently updated with a host of new data, providing a much broader and more detailed picture than ever before of China’s activities to win over foreign leaders and publics in what Beijing considers its “greater periphery.”
Launched in late 2019, AidData’s dashboard and an accompanying report, Silk Road Diplomacy, examines how China deploys its public diplomacy toolkit across the geostrategically important South and Central Asia (SCA) region. The report is newly available in an HTML version, and the executive summary has been translated into Russian.
Using the dashboard, users can now filter, create, and export their own custom graphs, maps, and in-depth country profiles with data from the Silk Road Diplomacy report and two prior reports on Chinese public diplomacy in East Asia, Ties That Bind and Influencing the Narrative.
What exactly goes into “public diplomacy”? Read our explainer.
The dashboard has been updated to include data on China’s financial, cultural, exchange, informational, and elite-to-elite diplomacy activities for 39 countries in Central Asia, South Asia, East Asia, and the Pacific covering 2000-2018. The full dataset can be downloaded directly here. New country profiles, also available through the dashboard, contain top-level summaries of China’s public diplomacy portfolio in a given country, presented in a systematic and comparable way.
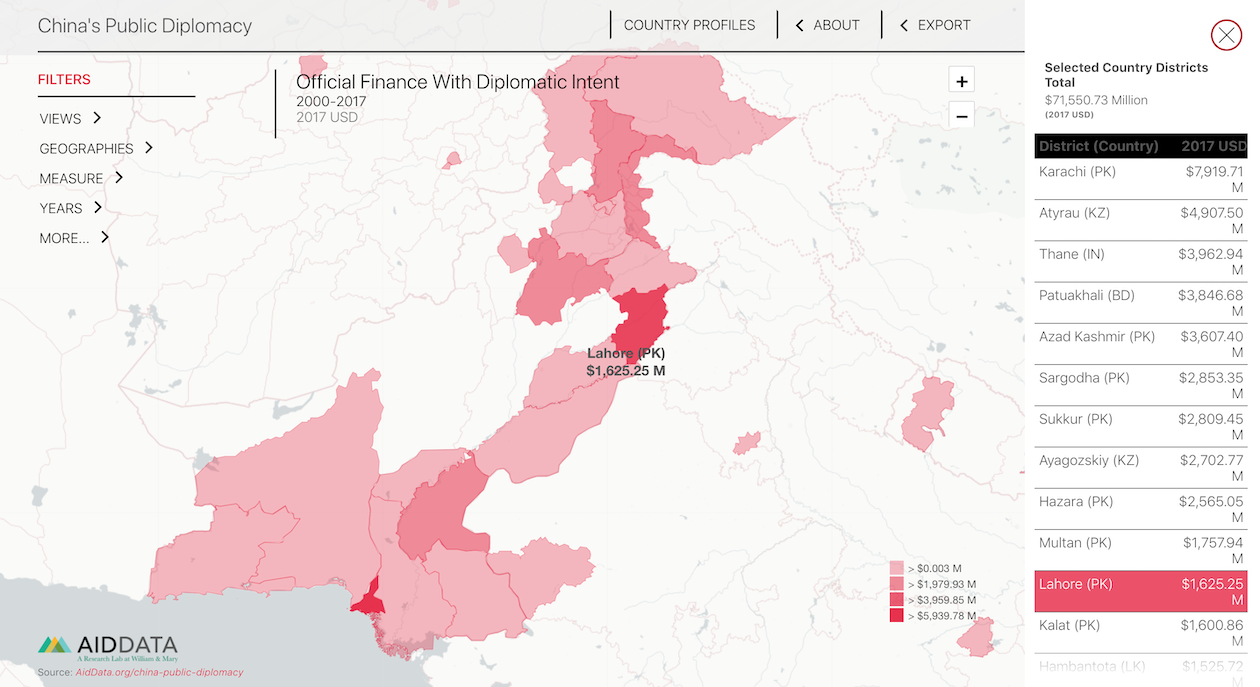
For the first time, users can visualize China’s financial diplomacy—arguably its most visible and controversial public diplomacy tool—at the province and district level for countries in South Asia and Central Asia.
A subset of government-directed overseas aid and debt instruments aimed towards advancing diplomatic objectives, financial diplomacy constitutes the vast majority of China’s public diplomacy efforts in the SCA region (worth $127 billion from 2000 to 2017). Users can further break this data down into four key categories: infrastructure investment, debt relief, budget support, and humanitarian assistance. More than 68.6% of financial diplomacy data for the SCA region can be tied to a specific province or district.
Currently, only financial diplomacy data is available in the dashboard at a subnational level, but additional subnational public diplomacy indicators will be incorporated later this year.
Viewing China’s financial diplomacy at solely the national level is akin to estimating the size of an iceberg by what’s visible above the waterline. By moving beyond the country level, users gain better insights into which subnational areas China is truly prioritizing. For the first time, users can zoom in on financial diplomacy data that has been disaggregated down to the province and even district level across South and Central Asia. This subnational view gives a leg up to policy and decision makers seeking insights into the distribution of China’s public diplomacy activities unavailable at the national level.
The dashboard allows users with knowledge of the region to examine where China's financial diplomacy is being directed within SCA countries; identify geographic patterns of where activities are most concentrated; and then apply their own expertise to test their hypotheses about why this might be the case. Are certain provinces or districts rich in heavy metals; key to the telecoms industry; or critical for energy resources or national security interests?
For power users, all subnational financial diplomacy projects also now have GADM (Database of Global Administrative Areas) polygon tags. Users can filter this geocoded project data by country or region and export the filtered view, with polygon tags, for manipulation in QGIS, ArcGIS, or other spatial data programs. A built-in table viewer also allows dashboard users to examine the type of project and project descriptions before exporting.
With such a broad range of metrics on Beijing’s influence toolkit, the dashboard provides users a true bird’s-eye view of China’s activities in almost all the countries that it borders or has close links to via trade and transport. An additional new feature of the recent July update is the ability to aggregate data up to the regional level, letting users zoom out to see how China is differentially targeting specific forms of public diplomacy across Central Asia, South Asia, East Asia, and the Pacific.
Lastly, beyond the ability to zoom in and out to subnational and regional levels, the dashboard also now includes the addition of individual country profiles. Users can generate succinct profiles, powerful tools for users interested in a bird’s-eye view of the total sum of China’s public diplomacy activities in a given country. Generated in an easy-to-print format, the country profiles are ideal for meetings and briefing booklets; they’re also uniform, enabling easy side-by-side comparison across two or more countries.
Readers can drill down into the specifics of each type of public diplomacy—financial, cultural, elite, information, and exchange—or obtain a comprehensive picture of trends with the time-series data. For example, each country's profile identifies the sector with the greatest level of investment, as well as the percentage of financial diplomacy over time that went to that sector.
You can explore the dashboard, download the full dataset, or read the Silk Road Diplomacy report on Beijing’s public diplomacy activities to influence South and Central Asia.

