Accessibility is one of the key attributes of ‘open’ data. With this in mind, AidData is excited to announce several improvements to our upcoming geocoded datasets that will lower barriers to entry for end users who want to see who is funding what and where they are siting their investments. Collectively, we refer to this suite of improvements as a “Level 1A” data product. All of AidData’s Level 1 geocoded datasets will now be accompanied by a Level 1A data product.
Introducing Level 1A: 3 New Features to Make Life Easier for Our Data Users
The Level 1A product differs from the standard Level 1 geocoded data product in three fundamental ways:
- Locations, projects, and transactions fields are represented in a single flat table;
- Project commitment amounts are disaggregated evenly across their locations, also known as even-split commitments; and
- Location records that are not subnational do not include geographic coordinates.
While the projects, locations, and transactions tables that have been standard to our Level 1 geocoded datasets since April 2014 are still most appropriate for research applications, the Level 1A product provides an easy, map-ready version of our geocoded data that is suitable for quick data visualizations, data journalism stories, and additional exploratory analysis.
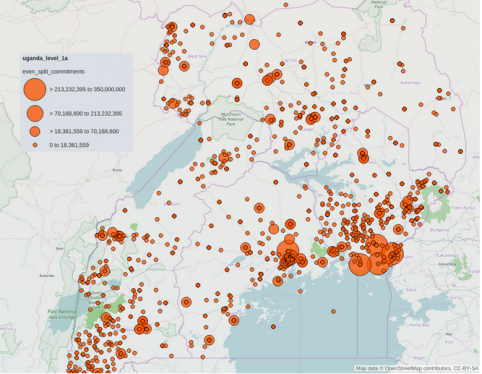
The map featured above represents our Level 1A data product for Uganda’s Aid Management Platform (AMP) with evenly-split project commitments (the even_split_commitments field). We encourage you to click on the map access the interactive version located on our ArcGIS Portal. Zoom, pan, and explore this map to get a sense of the spatial distribution of development project activities in Uganda. You can select markers, representing project locations, to further investigate specific project attributes.
Join us next week on the First Tranche for a tutorial on using the Level 1A product to create this web map. We will be using the free, trial version of ArcGIS online and walking readers through the basics of importing, styling, and sharing our geospatial data with a web map.