In Africa, smallholder farmers are the largest poverty group. Sub-Saharan Africa faces widespread chronic food insecurity and persistent threats of famine, conditions that are expected to worsen with climate change. Gender-based inequalities within agriculture constrain the key role that women can play in reducing poverty and food insecurity. However, poverty is difficult to define by gender, since conditions of men and women vary between and within regions, as well as across ethnic groups. Certain location and cultural dimensions have made it challenging to target vulnerable groups effectively. Geographical Information Systems (GIS) can give us new insights into the gendered nature of agriculture. Utilizing geocoded data, such as that available from the Uganda Aid Management Platform, researchers can use spatial data to understand how the gendered dynamics in Uganda make it difficult for women to realize their full potential in agriculture.
Uganda is highly dependent on agriculture with about 85 percent of its population living in rural areas. The government of Uganda has worked over the past decade to enhance food security, yet agricultural output has not grown at a high rate. With a rapidly growing population, food security is a major concern. Currently, more than two-thirds of Ugandans live in food insecure households. Aside from low productivity due to the limited use of improved technologies and declining soil fertility, the constrained contribution of women is a key challenge to increasing agricultural production. About two-thirds of all employed women work in agriculture, primarily in subsistence farming. Socio-cultural factors constrain resources needed to grow commercial crops and effectively limit the role of women in agriculture. According to pervasive social norms in Uganda, women are supposed to feed the family, so they tend to grow subsistence crops, while men tend to grow cash or commercial crops. Lower levels of wealth, education and ownership of assets limit the role of women in commercial farming, which in turn affects overall agricultural productivity. Research shows that women are just as productive as men if provided the same resources, which unfortunately is not the case.
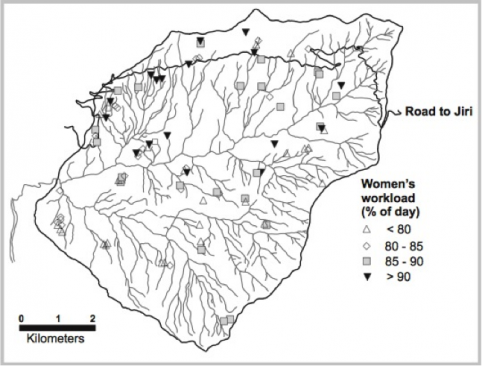
So how can GIS help? The below map from a paper by Sandra Brown (2003) illustrates how spatial analysis can be used to make sense of how location dimensions like access to road effect women’s work loads. The map shows that the percentage of the day that women spend working is greater for households closer to the road. Households with better road access tend to have smaller landholding so male members require off-farm employment to meet their needs, which puts a greater burden on women.
Figure 1: Spatial difference in the percentage of day that women spend working.
Using GIS, we can have more effective and targeted interventions for problems like low economic growth and food insecurity in Uganda. For instance, the most binding constraint (e.g. access to credit, distance from markets, low literacy rates) in a certain region can more easily be identified using data visualizations such as the map above and then addressed accordingly. There is growing recognition of the power of spatial analysis in assisting development programs but, to date, the importance of mapping gender in development programs remains limited.