“Ghost teachers” are not other-worldly beings, but non-existent teachers paid regular salaries. In Uganda’s Mbabara District, over 100 primary school teachers received salariesdespite the allegation that many of them are in Rwanda. Ghost teachers are not the only pseudo-employees to haunt government payrolls – ghost doctors, policemen, and soldiers waste government resources too. These hidden expenses add up. A 2013 effort to removeghost workers from the government payroll in Uganda resulted in approximately $1.4 billion (3.7 billion Ugandan shillings) worth of savings in the first third of the year alone.
Budget mismanagement – including, but not limited to the issue of ghost workers – is a major issue in Uganda. Donors have cut assistance in recent years in response to corruption and concern is mounting over budget accountability in the wake of the Ministry of Finance’s release of the 2014-2015 National Budget. These developments prompted the Ugandan government to launch the Budget Transparency Initiative tasked with created www.budget.go.ug, a portal for all budget-related data from the local to national levels.
This summer, I’m working with the Uganda Debt Network – a local NGO advocating for anti-corruption measures, more transparent service delivery, and pro-poor policies. As an AidData Summer Fellow, I’m helping the Uganda Debt Network put geospatial analysis and open data to work to advance these advocacy efforts.
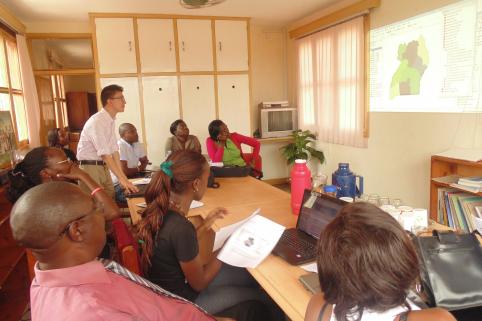
Daniel Chapman conducts a GIS training at Uganda Debt Network
The Ministry of Finance took a big step forward in opening up their data with the launch of Uganda’s Budget Portal. But what can open data do for organizations like Uganda Debt Network? The portal is a starting point for the public to see what the government is (or should be) doing in their area.
Some quick analysis of publically available budget versus allocation figures gives an insight on why having this data at ones fingertips can be powerful. Using this table from Uganda’s Budget Draft Estimates Volume II Report, I compared the approved total budget for each district with their actual budget expenditures at the end of the year (i.e., their provisional outturn). From there, I created a ratio of outturns to approved totals during the 2012-2013 fiscal year. Lower ratios indicate that districts spent less than what they were given, while higher ratios indicate that districts spent proportionally more. The map with these results is shown below (data was not available for Kampala District):
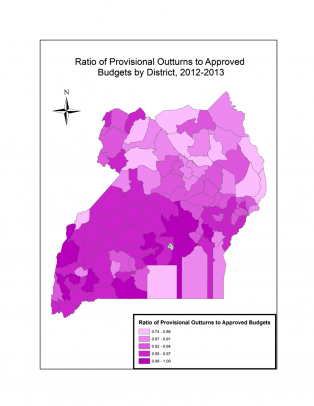
Seeing the map raises some interesting observations. Districts in the north generally spend around 75-85% of their allocated budgets, while districts in the west and around Kampala spend much more. Kalangala District, covering mostly Lake Victoria and the Ssese Islands, is an exception to this pattern. One possible explanation for this pattern is that districts that are harder to reach, such as Kalangala or parts of the north, are harder for the central government to oversee, creating more opportunities for waste and corruption to happen. While the map alone cannot explain the causes for this unequal distribution of expenses, by visualizing open budget data, we are able to easily see discrepancies in budget allocation among districts and ask questions about why this is the case.
Maps like the one I made for this post are relatively easy to create and can help communicate information to a variety of audiences in Uganda about aid projects, budget distribution, and poverty more quickly than a massive report tucked away in a bureaucrat’s drawer. Visualizing budget information may reveal misallocations of resources, improve evidence-based analyses of aid distribution and impact, as well as enabling citizens to knowledgably dialogue with their governments about development priorities.
The Ugandan government still must take more strides toward making more of its data open and accessible, but by making its budget information publicly available, it is on the right path. As citizens and public interest groups are armed with better data, we can hope that fewer ghosts will remain on government payrolls and that budgetary waste will decrease.